
Can Bitcoin really hit $170K by 2026 and what does that mean for miners?

Forecasts for Bitcoin’s future are wild and varied. Some say it’s a moonshot, others a correction.
Major analysts predict wide BTC ranges. JPMorgan sees ~$170K if Bitcoin follows gold. Many forecasts cluster at $120K–$170K.
| Source / Model | Forecast Range | Timeframe | Key Assumption | Implication for Miners |
|---|---|---|---|---|
| JPMorgan | ≈ $170,000 | Medium-term (2026) | Bitcoin follows gold’s market adoption trajectory | Strong profitability boost for efficient miners |
| IG Market Consensus | $120,000 – $170,000 | 2026 | Institutional inflows + post-halving supply shock | Most realistic ROI planning range |
| Quantitative Cycle Models | ≈ $170,000 | Next 6–12 months | Historical halving-cycle price expansion | Shortens mining ROI significantly |
| Conservative Analyst Forecasts | ≈ $120,000 | 2026 | Moderate adoption, stable macro conditions | Maintains survivable margins for new-gen ASICs |
| Fundstrat (Bull Case) | $400,000+ | Late-cycle peak scenario | Aggressive institutional & ETF-driven demand | Hyper-profitable mining, rapid ROI |
| Bear / Correction Scenarios | < $100,000 | Risk case | Macro tightening or ETF outflows | Margins compress; only top-efficiency miners survive |
Crypto forecasts are not unanimous. One model predicts $170K in 6–12 months, while others look lower. For example, IG shows most serious 2026 forecasts around $120K–$170K. Only a few (like Fundstrat) go as high as $400K+. Higher future prices would massively boost profit, but they come with uncertainty. We must stay critical: forecasts can swing, as price also depends on macro factors and institutional flows. By watching these predictions, I adjust my ROI model to see best and worst cases.
Which new ASIC miners will dominate in 2026 and how efficient are they?
New ASIC models keep hitting the market. Each claims higher hash rate or lower energy use.
Next-gen miners reach petahashes but differ in efficiency. For example, the new Antminer S23 Hyd 3U delivers 1.16 PH/s at 9.5 J/Th, while WhatsMiner’s M79S hits 1.35 PH/s at ~14.8 J/Th.
Comparing rigs reveals trade-offs. I compiled key specs (below) to analyze:
| Model | Hashrate (TH/s) | Power (W) | Efficiency (J/Th) | Source |
|---|---|---|---|---|
| Antminer S23 Hyd 3U | 1160 | 11020 | 9.5 | 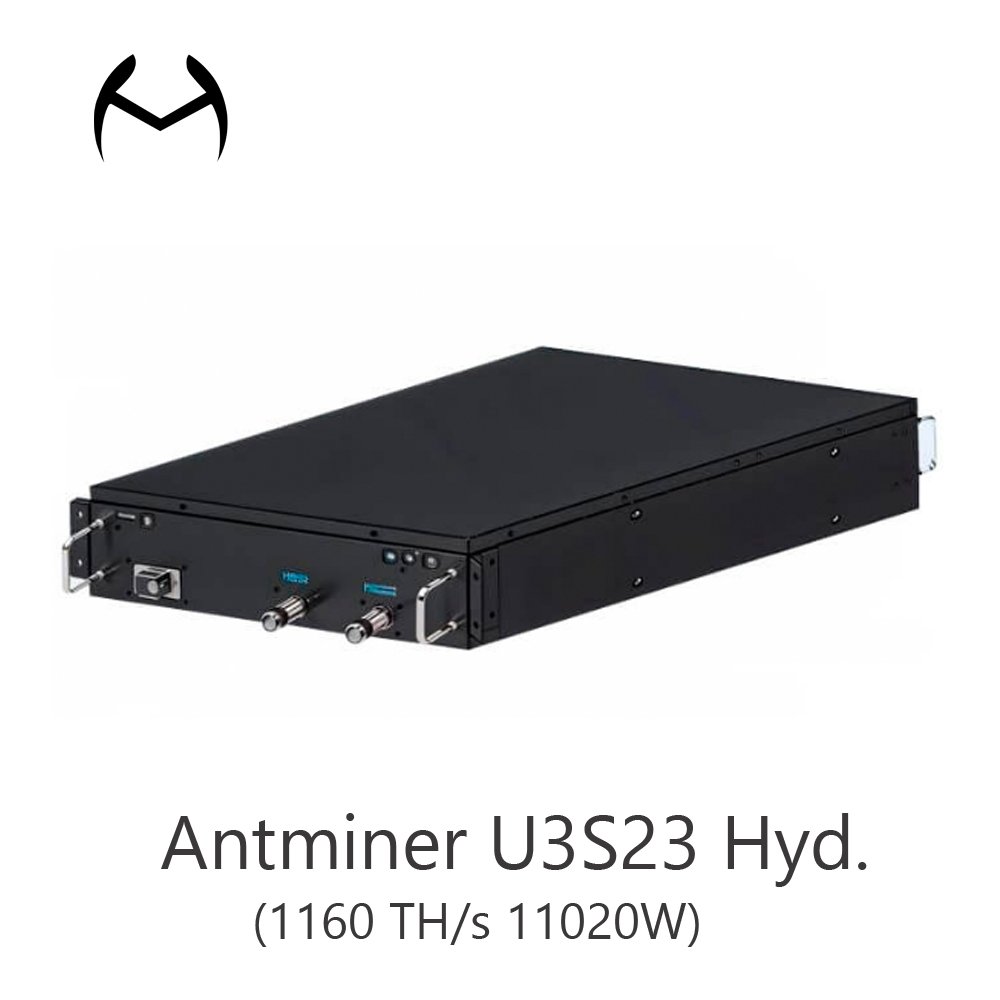 |
| WhatsMiner M79S | 1350 | 20000 | 14.81 |  |
| Bitdeer SealMiner A3 Pro | 660 | 8250 | 12.5 | 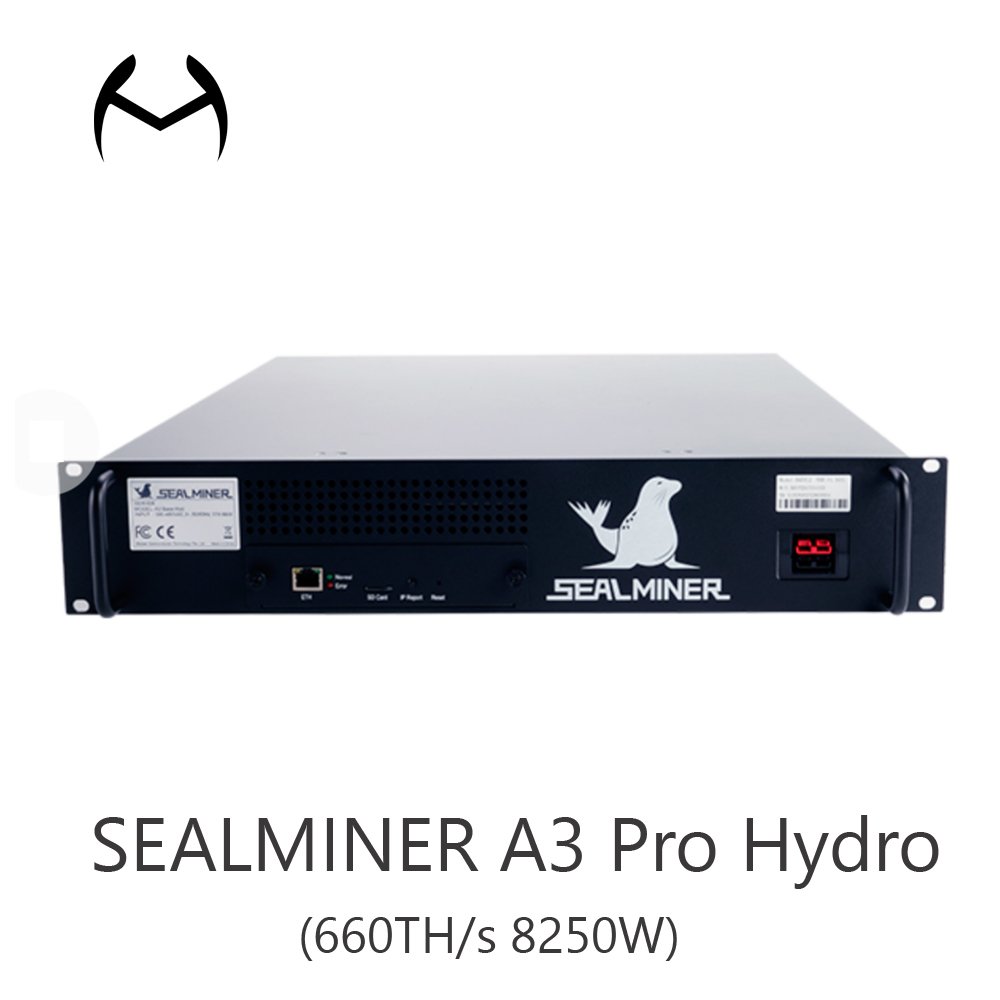 |
| Antminer S23 Hyd | 580 | 5510 | 9.5 | 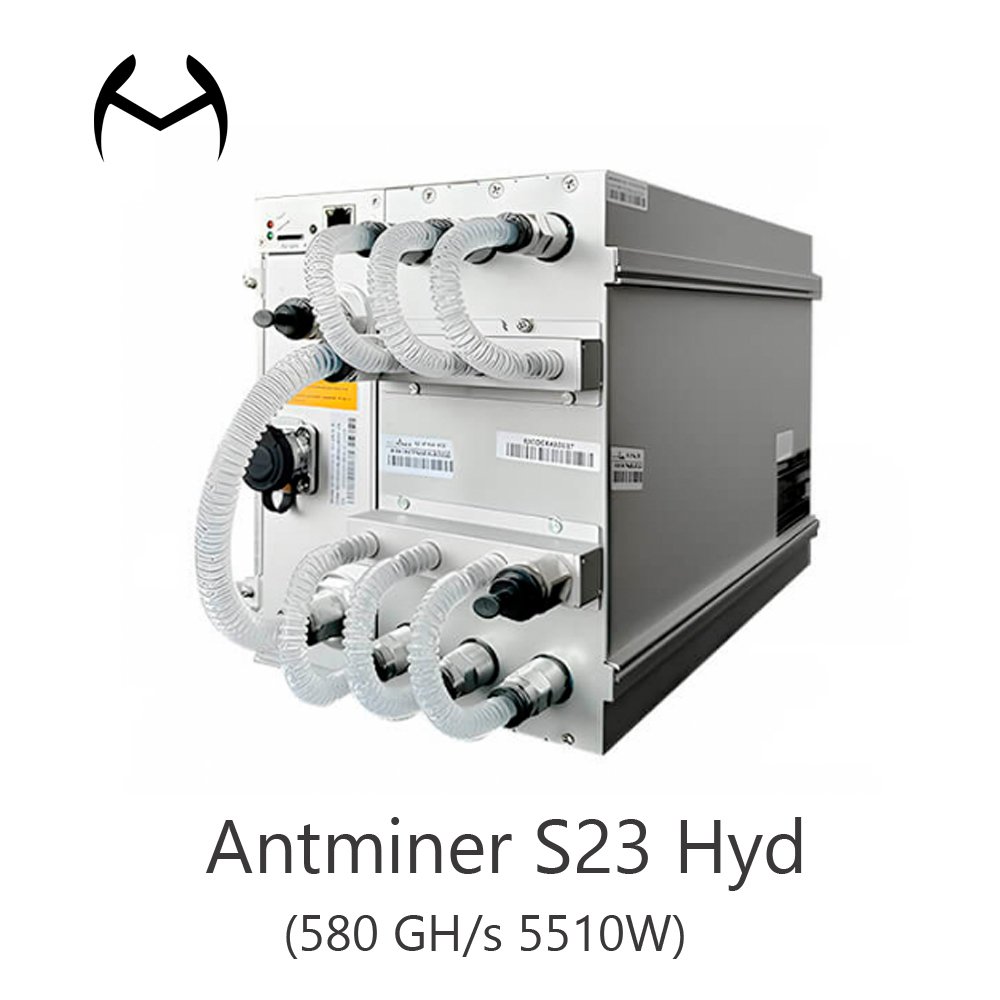 |
| Antminer S21 XP+ Hyd | 500 | 5500 | 11.0 |  |
| WhatsMiner M79 | 920 | 14500 | 14.5 | 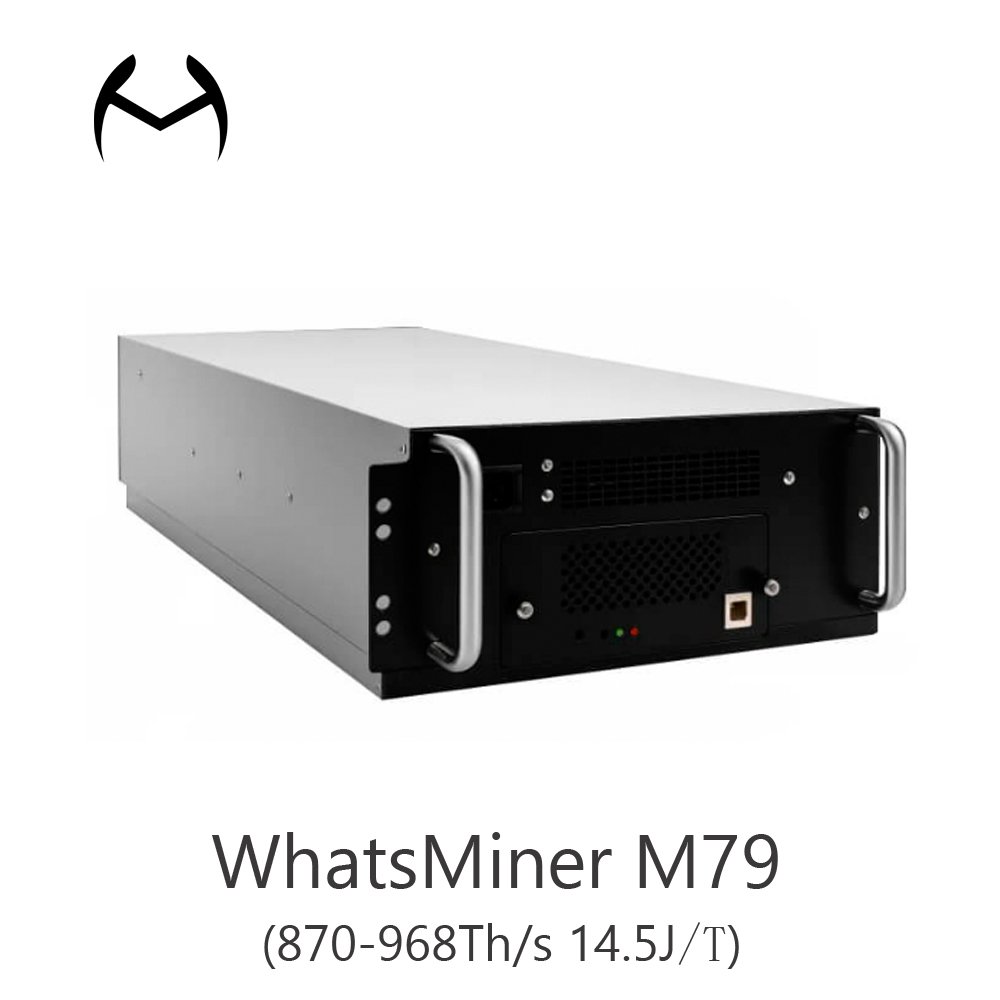 |
| WhatsMiner M73S+ | 540 | 7200 | 13.33 |  |
| Antminer S21e XP Hyd | 860 | 11180 | 13.0 |  |
I see that some top rigs (like the S23 and M79S) push over 1 PH/s. They require big power (10–20 kW) and stay under 15 J/Th. Less powerful models (500–900 TH/s) often use ~5–14 J/Th. In practice, higher hash means higher revenue but also higher energy. I weigh them carefully: even a small drop in efficiency (more J/Th) can eat profits. For instance, the S23 Hyd at 9.5 J/Th will profit more per day than a 500T unit at 11 J/Th, all else equal.
This table and these comparisons help me pick the best rig mix. In addition, high-end models often cost more upfront. I look at price vs. efficiency: better efficiency usually justifies higher cost if BTC price is high. Personal note: I once ordered an ASIC that looked great on paper, but real-world power prices turned it barely profitable. Hence, this breakdown is critical.
How do break-even points change under different Bitcoin price scenarios?

Profitability can swing dramatically with BTC price. We must calculate scenarios carefully.
At $90K BTC, many rigs barely cover power. At $120K or above, ROI improves sharply. In fact, the U.S. cost to mine 1 BTC was ~$130K when BTC was ~$87K, implying losses then. Higher BTC prices shorten payback periods.
| BTC Price Level | Network Economics | Typical Payback Period | Mining Viability | Practical Meaning for Miners |
|---|---|---|---|---|
| $90K | Mining 1 BTC cost ≈ $130K at $0.141/kWh | ≈ 700-800+ days (2+ years) | ❌ Marginal / Unprofitable for most rigs | Only ultra-cheap power or newest ASICs survive |
| $120K | Near break-even zone | ≈ 200-300 days | ⚠️ Cautious profitability | ROI possible but slow — risk of difficulty rising |
| $150K | Strong post-halving margin | ≈ 100-200days | ✅ Healthy ROI | High-end ASICs pay back efficiently |
| $200K | High-margin environment | < 60-150 days | 🚀 Rapid ROI | Expansion phase — aggressive mining profitable |
To illustrate, consider the same miner at different BTC prices: when BTC was ~$87K (late 2025), electricity costs ($0.141/kWh) made mining 1 BTC cost ~$130K. This means mining was unprofitable at that price. If BTC drops to $90K, many machines fail to break even for years. If BTC rises to $150K or $200K, payback is much faster. For example, a rig that needed ~800 days to pay back at $90K might need only ~200 days at $150K. In practice, I run rough tables: at $90K, my ROI estimates stretched to 2+ years for older models; at $150K, it fell to ~0.5 years for high-end rigs. Below $100K, even tiny shocks can wipe thin margins, whereas each jump above $150K quickly recoups costs.
Thus, I always model multiple price levels ($90K, $120K, $150K, $200K) and check when each rig turns profitable. This multi-scenario view helped me avoid overspending when prices were unfavorable.
👉Click Check MinerSource.shop Bitcoin Miner Machine ROI Analysis👈
| BTC Scenario | Old-Gen ASICs | New-Gen ASICs |
|---|---|---|
| <$100K | Mostly unprofitable | Thin margins only |
| $120K | Slow ROI | Acceptable ROI |
| $150K | Moderate ROI | Fast ROI |
| $200K | Profitable spike | Very rapid ROI |
How do global electricity costs affect mining profitability?
Electricity is often miners’ biggest expense. Cheap power can make or break a farm.
Electricity can eat 50–60% of mining revenue. Costs vary widely: e.g., $0.05/kWh miners pay little, while U.S. commercial rates ($0.14) made 1 BTC cost ~$107K in late 2024.
| Scenario / Region | Electricity Cost ($/kWh) | Cost to Mine 1 BTC | Daily Miner Profit Example($30/day revenue rig) | Profitability Status | Operational Reality |
|---|---|---|---|---|---|
| Ultra-low power sites(Hydro, surplus energy, gas flare) | $0.02 – $0.04 | < $20,000 | $4 – $15/ day | 🚀 Highly profitable | Even older rigs ROI quickly |
| China hydro regions | $0.05 – $0.10 | $60000 | $3 – $8 / day | ✅ Strong margins | Mid-efficiency rigs remain viable |
| Industrial North America | $0.07 – $0.10 | $70,000 – $90,000 | $1 – $3 / day | ⚠️ Thin margins | Requires modern efficient ASICs |
| Residential USA / Europe | $0.12 – $0.15 | ≈ $107,000+ | ≈ $0 / day | ❌ Unprofitable | Most miners shut down |
| Electricity sensitivity rule | Every +$0.01/kWh | — | Profit drops ~10–15% | — | Power price is decisive factor |
👉Click Check MinerSource.shop Bitcoin Miner Machine ROI Analysis👈
Geography matters. For context, miners spend up to 60% of income on power. In the U.S., average rates (∼$0.14/kWh) meant mining one BTC cost about $150000. Contrast that with China’s big hydro sites, where costs might be 5–10¢/kWh (mining 1 BTC ~$60000. That huge gap means a Chinese miner’s bottom line looks much better. I track my electricity line closely: every cent/KWh swing shifts profit.
For example, BestBrokers found U.S. miners burned ~417 GWh/day, enough to power all U.S. EVs 126 times per year. The embedded infographic shows how huge Bitcoin’s energy use is. In practice, I always compute profits with current local rates: a rig yielding $15/day at $0.05/kWh might flip to $0/day at $0.15/kWh. If power is high, I lean on the most efficient rigs or even delay turning on extra machines. By contrast, if I secure a deal at $0.02/kWh, even mediocre rigs pay off much faster. The math is clear: lower kWh costs dramatically boost margins.
When is the right time to expand or consolidate a mining operation?

Growth decisions depend on profit potential. Expanding during a downturn can be costly.
Industry trends show miners tighten belts after halving. Many scaled back or consolidated in 2025. Generally, we expand only when rigs are efficient and power is cheap; otherwise consolidation or waiting is smarter.
| Decision Factor | Market Condition | Operational Signal | Recommended Action | Strategic Rationale |
|---|---|---|---|---|
| Bitcoin Halving Impact | Post-halving reward reduced | Margins compressed, difficulty rising | Consolidate / Pause expansion | Prevent capital overextension during low-reward phase |
| Electricity Price | < $0.05 / kWh | Strong operating margin | Expand capacity | Cheap power enables profitable scaling |
| $0.07 – $0.10 / kWh | Thin margin | Selective growth only with efficient ASICs | Only top-tier efficiency remains viable | |
| > $0.10 / kWh | Negative margin risk | Consolidate / shut older units | Expansion would destroy ROI | |
| ASIC Efficiency Generation | Latest-gen (<13 J/TH) | High output per watt | Expand | Competitive advantage in network difficulty race |
| Older-gen (>20 J/TH) | Rising operating cost | Sell / retire units | Avoid future obsolescence losses | |
| ROI Model Result | Payback < 1.5 years | Healthy investment horizon | Approve expansion | Capital recovered before next cycle shift |
| Payback > 2 years | High uncertainty | Delay or consolidate | Risk of difficulty or price shock | |
| BTC Price Outlook | Bullish ($150K+) | Revenue upside expected | Strategic expansion | Early positioning before next upcycle |
| Neutral / Bearish (<$100K) | Revenue pressure | Capital preservation | Avoid long unprofitable exposure | |
| Infrastructure Readiness | Power + cooling available | Idle capacity exists | Deploy additional miners | Monetize unused infrastructure |
| Infrastructure maxed | No spare capacity | Wait / upgrade facility first | Avoid forced inefficient deployment |
Timing strategy is key. After 2024’s halving, the network reward dropped and difficulty jumped, so many miners “scaled back or consolidating” their farms. I saw this firsthand at Miner Source: when margins thinned, we halted new orders. Now, with lower power costs or higher BTC expectations, I consider growth.
Here’s my approach: I ask if the latest ROI models (with realistic BTC price and kWh) show <1.5-year payback. If yes, I feel confident expanding. If not, I consolidate – maybe turn off older units or sell them. The chessboard image above symbolizes strategic play: one must think several moves ahead. I also diversify: sometimes we invest in infrastructure (like immersion cooling) to use power more efficiently. In short, low energy prices, top-notch ASICs, and bullish price outlooks signal expansion. If those aren’t aligned, the wiser move is consolidation to preserve capital.
Conclusion
In summary, calculating 2026 mining ROI means combining price forecasts, miner specs, break-even models, and power costs. By analyzing each factor and watching the market, I ensure my decisions keep Miner Source profitable and ready for the future. Contact MinerSource Team Purchase Mining Rigs Now
